
|
|
The LHC generates about 1 billion collisions per second just within the ATLAS detector. The collision sites are surrounded by vast arrays of detectors which map the 3-D structure of the debris arising from these events. From the billions of events, a small group of about 200 events per second will be selected, by computer, which bear the signature of various interesting patterns, including the possible decay routes of the Higgs boson. This process is known as triggering. The current software for the LHC has in excess of 500 different triggers corresponding to various processes of interest. For more information, click here.
The Higgs boson decays by several pathways. One route predicts decay into two very high energy gamma rays (H → γγ) which should leave an easily recognizable signature in the detector. The gamma rays would not leave a track in the central detectors but would deposit all their energy in two regions of the surrounding electromagnetic calorimeters (ECALs). Electrons and positrons also deposit their energy in the ECALs but they leave tracks in the inner detector. Other particles, such as pions and muons, will leave traces in the ECALs and in other detectors beyond the ECALs.
|
|

The signature of an H → γγ decay then is exactly two energy deposits in the ECAL coming from particles which leave no tracks in the inner chamber and are completely stopped by the ECAL. The adjacent image shows a computer simulation of such an event. The energy of the photons is shown as red "towers" at the location on the electromagnetic calorimeter where the photon hits the detector. This view of the data is an end view of the detector along the beam line.
Higgs researchers will receive only the most promising events from the billions that occur each second. Many of these candidate events will contain photons from other sources. Pairs of such photons will have a wide range of masses and give a smooth continuous distribution of events above and below the Higgs mass. True Higgs events will have the two-photon invariant mass in a narrow range of masses. If sufficient candidate events can be collected then a visible Higgs peak should emerge above the background.
|
|
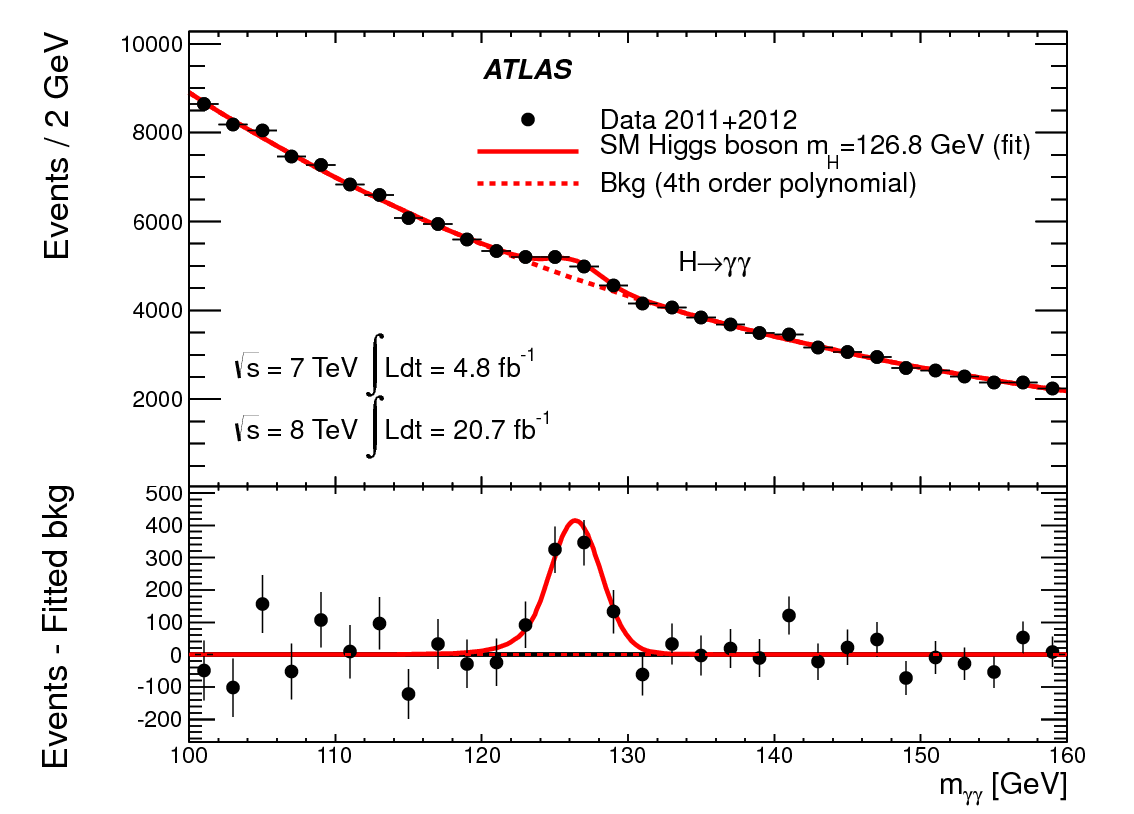
The 'proof' of the existence of the Higgs lies in the statistical significance of its peak. The graphs above show the results from the H → γγ channel which showed a Higgs with mass 126.8 GeV (this value is from 2012; the currently accepted is 125.18 ± 0.16 GeV according to the Particle Data Group). The top image shows the data (black dots), the expected value according to prediction (the solid red line) and the background value (dashed red line). The difference between the data and the background shows that there is some particle at 126.8 GeV due to there being a significant peak. The mean value of the peak gives the mass of the Higgs particle whilst the height above the background shows its statistical significance. In particle physics, the statistical threshold for discovery is deemed to be 5 standard deviations above background.