
Simulation Theory
Neutrinos are only detected when they interact with the matter in a detector. Only a few out of 1015 neutrinos will interact even in a large detector. That is why T2K needs a very intense beam of neutrinos and a large-volume far detector. At T2K, when neutrinos interact via the charged-current weak interaction, electron neutrinos produce high energy electrons whilst muon neutrinos produce muons. By measuring the tracks and energy of these particles it is possible to compute the energy of the parent neutrino.
In some cases, a higher-energy neutrino may produce a pion in addition to the charged lepton. Although we will not simulate these types of events in this exercise, you can see that our detector below would be able to separate events with pions from events without pions. At T2K, it is important to do this in order to correctly reconstruct the neutrino's energy.
Our simulated detector for this exercise is built in five sections, illustrated in the diagram below.
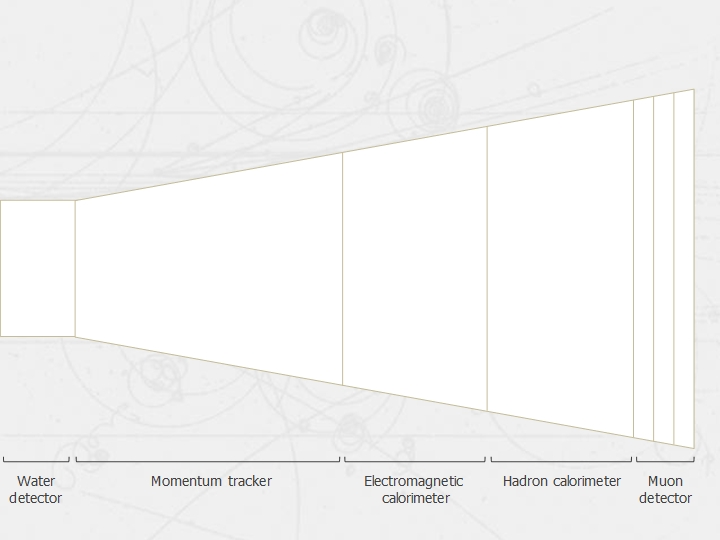
The detectors
Each section has a special function:
- The water detector is where the incoming neutrinos interact with water nuclei producing electrons, muons and pions.
- The momentum tracker uses a magnetic field to bend the path of the particle depending on its charge and momentum.
- The electromagnetic calorimeter is where electrons are stopped completely. If the particle is a muon, some energy is deposited.
- The hadron calorimeter is where pions are stopped completely. If the particle is a muon, some energy is deposited. If the pions were not stopped then they would leave the same tracks as muons causing confusion.
- Finally, there is a muon detection system which is made of 3 smaller detectors. Each of these detects the presence of a particle which has not been stopped in the electromagnetic calorimeter or the hadron calorimeter. Since we stopped all electrons already, any particle detected here must be a muon.
From the tracks and energy distribution within the layers of the detector, it is possible to distinguish muons from electrons and hence establish the ratio of muon to electron neutrinos in the incoming beam.
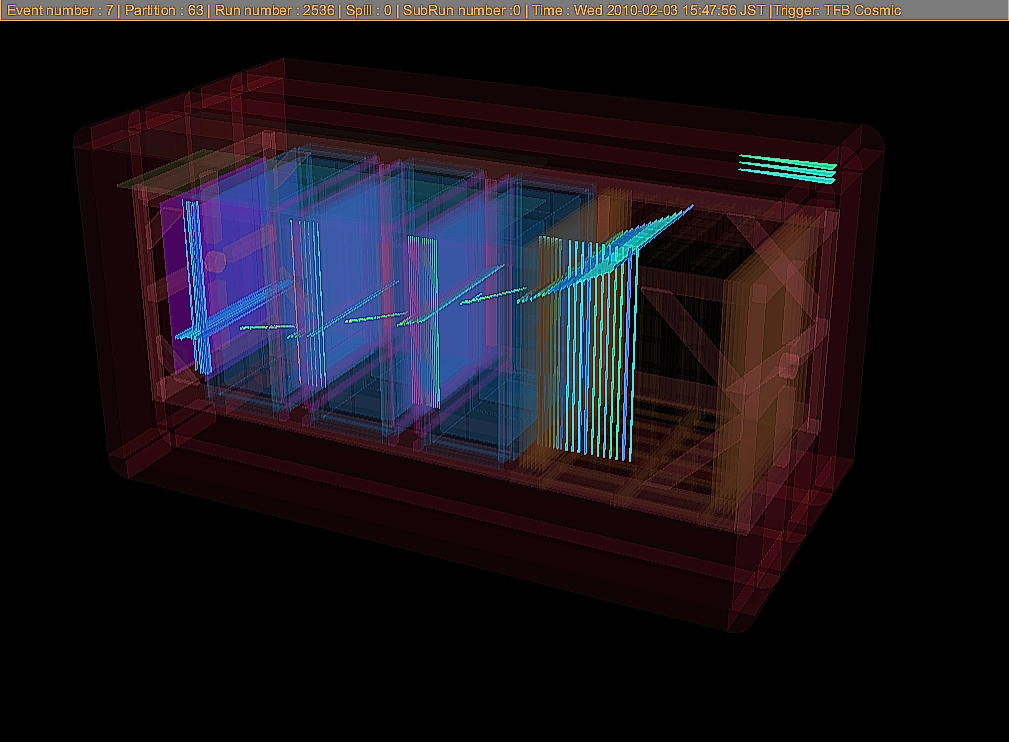
A muon event in the ND280 detector at T2K
A histogram of the results is automatically generated. Curves can be fitted to the histograms and from these curves both the mixing angle and the difference in the squares of the masses of the incoming neutrinos can be calculated.
The curve is fitted by using a chi-squared minimisation technique. Chi-squared can be thought of as a number which represents the goodness of a fit to a data set. The lower the value, the better the fit. The actual shape of histograms should correspond to the neutrino mixing formula shown below.
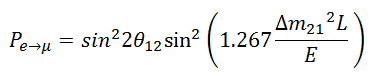
The neutrino mixing formula
In this formula, Pe→μ is the probability that an electron neutrino will mix to a muon neutrino, θ12 is the mixing angle, Δm212 = m22 − m12 is the difference of the squares of the masses between the two neutrino mass states in eV, L is the length of the detector in km and E is the energy of the neutrino in GeV.
To generate the fit we vary the mixing angle, θ12 and the mass difference, Δm212 until we find the minimal value of chi-squared and thus the best possible fit for the data.
We started with a uniform energy distribution of muon neutrinos but in the muon histogram (left) below part of the muon energy spectrum is 'missing'. The missing muons correspond with the appearance of electrons in the electrons histogram (right). This is characteristic evidence of neutrino mixing. Adding the muon and electron histograms together gives back the uniform energy spectrum we would expect if neutrino mixing had never occurred.
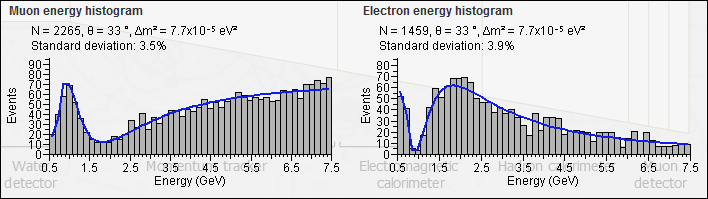
Histograms and fitting curves